
Federator.ai® Integration
Federator.ai integration with Sysdig to optimize application performance Sysdig Integration
Federator.ai® Integration
Federator.ai integration with Sysdig to optimize application performance Sysdig Integration
ProphetStor Federator.ai®
ProphetStor Federator.ai is an AI-based solution that helps enterprise manage, optimize, auto-scale resources for any applications on Kubernetes. Using advanced machine learning algorithms to predict application workload, Federator.ai scales the right amount of resources at the right time for optimized application performance.
- AI-based workload prediction for Kafka consumers or any applications
- Resource recommendation based on workload prediction, application, Kubernetes and other related metrics
- Automatic scaling of application containers through Kubernetes Horizontal Pod Autoscaler via Sysdig extension API server.
- Application cost analysis estimates potential savings when following resource allocation recommendations
- Closed-loop automation for continuous resource optimization for applications
Federator.ai® Dashboard Overview

Recommended Replicas vs Current/Desired Replicas
This timeseries graph shows the recommended replicas from the Federator.ai and the desired and current replicas in the system.

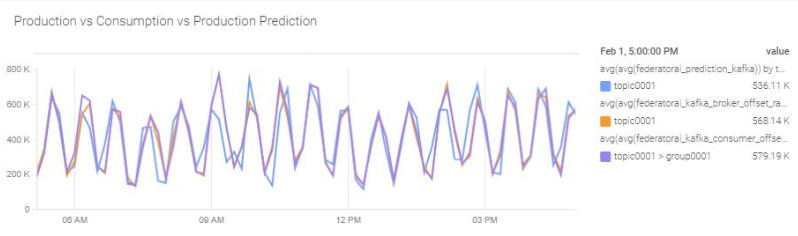
Production vs Consumption vs Production Prediction
This timeseries graph shows the Kafka message production rate and consumption rate and the production rate predicted by Federator.ai.
Kafka Consumer Lag
This timeseries graph shows the sum of consumer lags from all partitions.

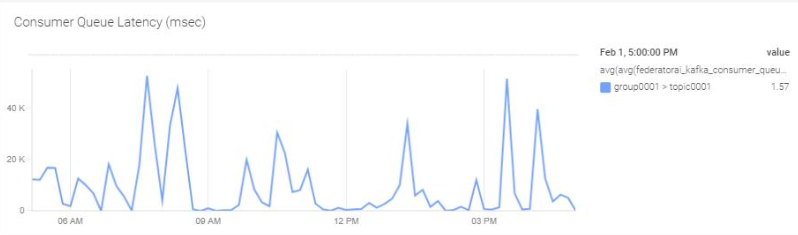
Consumer Queue Latency ( msec )
This timeseries graph shows the average latency of a message in the message queue before is it received by a consumer.
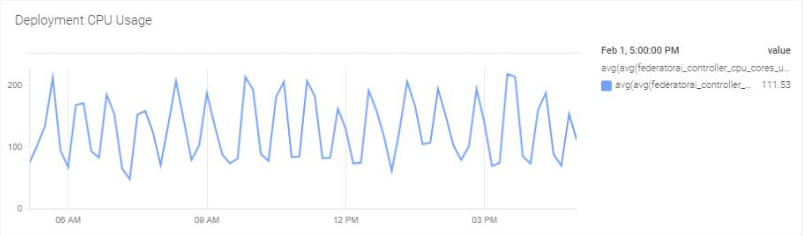
Deployment CPU/Memory Usage
This timeseries graph shows the CPU and memory usage of consumers.

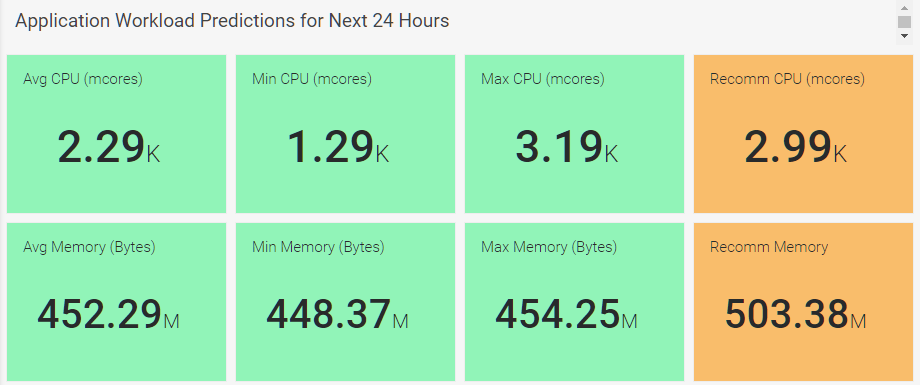
Application Workload Predictions
The information panel shows the workload predictions and recommendations of applications for next 24 hours, 7 days and 30 days. This example shows the workload predictions and recommendations for next 24 hours.
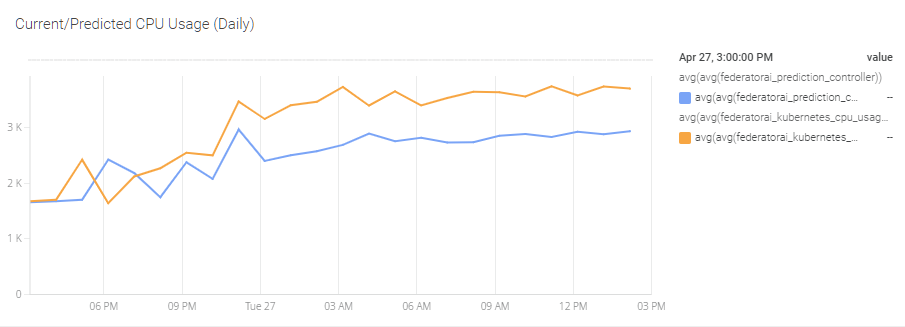
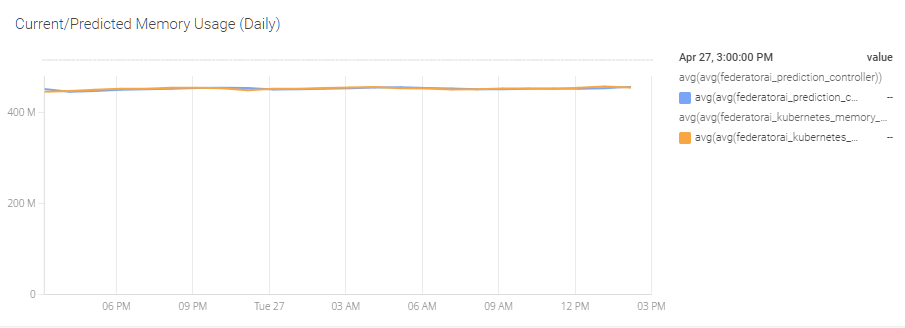
Application Resource Utilization and Prediction History
This timeseries graph shows the current and predicted CPU and memory daily/weekly/monthly usage of applications. This example shows the current and predicted CPU and memory daily usage.