
What "GPU Util" Actually Measures
- Functional unit activity – It doesn’t show whether FP32 units, Tensor Cores, or memory controllers are actively working or sitting idle.
- SM occupancy – It ignores how fully the SMs are used. An SM may be active but running only a small number of warps (e.g., just 1 out of many possible).
- Voltage/frequency state – It doesn’t account for power-saving features like DVFS (Dynamic Voltage and Frequency Scaling) or clock-gating, where parts of the chip may run slower or be temporarily turned off.
Example cases where "100% Util" masks variable heat output
The utilization.gpu metric often shows 100%, but this can be misleading. The table below compares what the metric reports with the GPU’s actual activity and power usage, and clarifies what that 100% utilization really means in different scenarios.
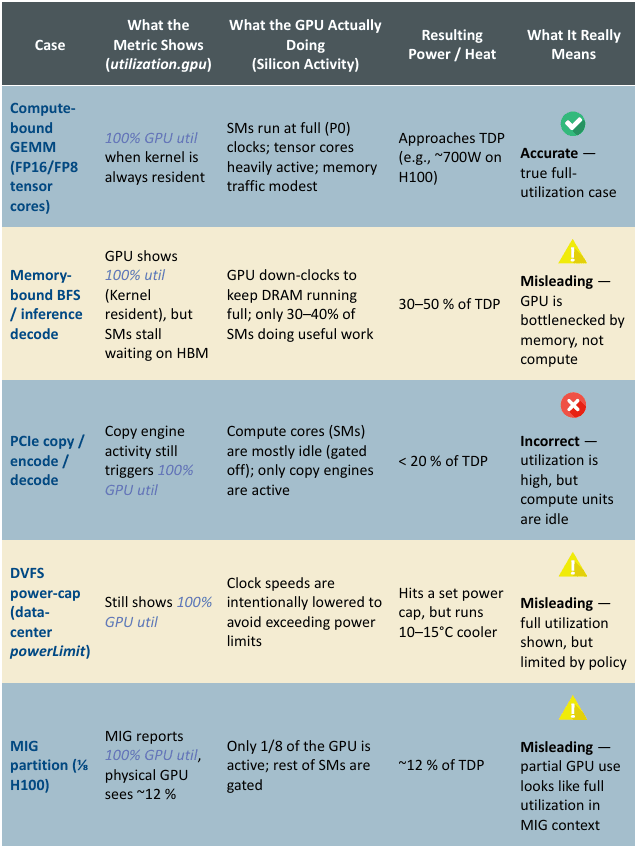
Case
What the Metric Shows (utilization.gpu)
What the GPU Actually Doing (Silicon Activity)
Resulting Power / Heat
What It Really Means
Compute-bound GEMM (FP16/FP8 tensor cores)
SMs run at full (P0) clocks; tensor cores heavily active; memory traffic modest
Approaches TDP (e.g., ~700W on H100)
Accurate
True full-utilization case
Memory-bound BFS / inference decode
GPU shows 100% util (Kernel resident), but SMs stall waiting on HBM
GPU down-clocks to keep DRAM running full; only 30–40% of SMs doing useful work
30–50% of TDP
Misleading
GPU is bottlenecked by memory, not compute
PCIe copy / encode / decode
Compute cores (SMs) are mostly idle (gated off); only copy engines are active
< 20% of TDP
Incorrect
Utilization is high, but compute units are idle
DVFS power-cap (data-center powerLimit)
Still shows 100% GPU util
Hits a set power cap, but runs 10–15°C cooler
Misleading
Full utilization shown, but limited by policy
MIG partition (⅛ H100)
Only 1/8 of the GPU is active; rest of SMs are gated
~12% of TDP
Misleading
Partial GPU use looks like full utilization in MIG context
* TDP (Thermal Design Power) is the expected maximum heat a GPU generates under typical peak load, measured in watts. It’s a design target—not the absolute power limit—used to size cooling systems for safe and stable operation.
Metrics to Track Real Heat Generation

Metric
NVML / DCGM Field
What It Tells You
Instantaneous board power
nvmlDeviceGetPowerUsage
Measures real-time power draw.
A direct proxy for heat output → use for liquid cooling CDU pump control.
SM active cycles (occupancy)
DCGM field 203 (sm_active)
Reports the percentage of cycles where any warp (thread group) issued an instruction. Gives a real sense of how active the GPU cores are.
Tensor Core active
DCGM 1002 (tensor_active)
Memory controller active
DCGM 1003 (dram_active)
Shows how often memory controllers are in use. Useful for identifying memory-bound workloads (e.g., inference decode or data transfer-heavy tasks).
Clocks & P-state
nvmlDeviceGetClockInfo and pstate
Reveals current clock frequencies and power state (performance state). Helps track DVFS (Dynamic Voltage and Frequency Scaling) and detect if the GPU is throttling or running at reduced performance to save power or control heat.
Ultimately, the best metric to gauge the thermal load is using the nvmlDeviceGetPowerUsage metric. And together with the pstate, we can decide how much heat is generated by workloads running on a GPU and if thermal throttling has happened because of inefficient cooling.
How Federator.ai monitors and manages thermal energy generated by GPU workloads
HI = (GPU Power Draw−GPU Idle Power)/(GPU Max Power−GPU Idle Power)
The range of the heat index will be between 0 and 1 based on this definition. Federator.ai monitors the scheduling and orchestration of GPU workloads and the fluctuation of the heat index of GPUs of the servers from the same rack, which are cooled by the same CDU. It also monitors in real time the CDU temperature sensors and coolant flow rate, and other CDU metrics. With this information, Federator.ai dynamically adjusts the CDU coolant flow rate that maintains optimal GPU operation temperature range while reducing energy used by the CDU.
It is also important to raise alerts and notifications in case any GPU temperature reaches its operation maximum operation temperature and is experiencing thermal throttling. Federator.ai monitors the GPU’s pstate metric for this purpose.
Federator.ai Smart Cooling system consists of the following three management planes for efficient thermal management.
- Real-time GPU Metrics Monitoring at the Edge
An edge agent is installed at each GPU server to collect and monitor DCGM metrics (power usage, temperatures, pstate) and compute the heat index of each GPU at 1-second interval. An alert is triggered if GPU thermal throttling occurs or GPU temperature reaches to a predefined max boundary.
- Thermal-Aware Workload Placement
Using metrics collected from the DCGM as well as from the liquid cooling system (e.g., CDU), Federtor.ai places the new GPU workloads to appropriate GPU servers so that it avoids hotspots and, at the same time, has the most efficient energy use of CDUs.
- Intelligent Smart Cooling Control
Federaor.ai interfaces with the external liquid cooling hardware, such as rack-based or in-row CDUs, and adjusts flow rate/valves so that GPUs are operating in the optimal temperature range with the least amount of energy.
The following table summarizes how Fedeartor.ai GPU Booster integrates the workload-aware IT plane and liquid cooling system facility plane into an intelligent smart cooling solution.

Layer
Concrete action
Why it matters in the “100 % util but low heat” reality
1. Telemetry ingestion
- Edge agent pulls DCGM board-power, GPU Temperature, pstate every 1s.
- Computes Heat Index
Board power and functional-unit counters track real joule-generation; utilization.gpu does not.
2. GPU Booster –
workload placement
- Tags every pod / Slurm job with heat budget (watts) and heat pattern (flat, bursty, decode). For new pod/slum job without any prior data, assume the highest usage for the resource (whole GPU or MIG) assigned.
- Packs memory-bound or MIG-slice jobs together so a single rack can run at lower pump RPM while compute-bound jobs fill a high-flow rack.
- Schedules gradient-sync phases out-of-phase across racks to flatten 10% duty ripple.
Separating “hot” and “cool” jobs raises total cluster throughput without over-cooling cold racks.
3. Smart Liquid Cooling –
rack loop control
- Switches the pump PID from ΔT feedback to Heat Index feed-forward.
- Flow adapts to actual heat, not the misleading 100 % util flag.
Ensures cooling is driven by real heat output, not misleading GPU utilization metrics — improves efficiency and avoids unnecessary overcooling.
Reference
- NVIDIA Developer Forum, ” Nvidia-SMI reporting 0% gpu utilization “, 2023. [Online]. Available: https://forums.developer.nvidia.com/t/nvidia-smi-reporting-0-gpu-utilization/261878.
- NVIDIA Developer, ” System Management Interface SMI “, NVIDIA. [Online]. Available: https://developer.nvidia.com/system-management-interface.
- NVIDIA Developer, “Measuring the GPU Occupancy of Multi-stream Workloads”, NVIDIA Blog, 2024. [Online]. Available: https://developer.nvidia.com/blog/measuring-the-gpu-occupancy-of-multi-stream-workloads/.
- Wang, “DSO: A GPU Energy Efficiency Optimizer by Fusing Dynamic and Static Information,” arXiv preprint arXiv:2407.13096, 2024. [Online]. Available: https://arxiv.org/abs/2407.13096.
- Open Compute Project Cooling Environments Project, Reservoir and Pumping Unit (RPU) Specification, Version 1.0, Nov 2022:
https://www.opencompute.org/documents/ocp-reservoir-and-pumping-unit-specification-v1-0-pdf.
Bottom line: a single “100 % GPU util” flag is a poor proxy for thermal load; Federator.ai should key its cooling logic on power and functional-unit activity, not the coarse utilization bit.